
On Monday April 3 I participated in a congressional briefing sponsored by the Population Association of America, and several other organizations, on the demography of rural America. I was asked to present about rural veterans in the short time span of twelve minutes, but twelve minutes goes by quickly and doesn’t offer much time to elaborate on the interesting and important issues in this area. Nor does it allow one to pontificate about the challenges of doing research on this particular topic. Having a blog gives me the opportunity to write about the details of what goes into preparing for presentations like this. In this instance, trying to identify a seemingly simple statistic to start the presentation turned out to be more challenging than I anticipated. The experience illustrates the difficulties in the practice of research and data analysis around military and veterans issues as much as it is a substantive story about rural veterans.
When thinking about how to structure this short presentation, I set out to try and understand who “rural veterans” were. As veterans currently residing in rural areas, I wanted to understand first whether they were people who joined the military from rural origins? Or did these veterans become rural residents during and/or after their service? Given the overall trends in this country of rural decline and aging, which my fellow presenters discussed before me (and you can see their slides in the earlier link), my operating assumption was that rural veterans were more likely to be rural origin recruits or draftees who returned back to their home communities after completing their military service. However, I also assumed that many who enlisted from rural origins wouldn’t return back home. Joining the military is a viable means of escaping the limited economic opportunities facing some rural youth, exposing these veterans to other communities across the U.S. and abroad.
Answering the question of “who are rural veterans, and where did they come from?” proved to be a challenge because our data on the longitudinal dynamics of enlistment, service, and the transition back to civilian life are virtually non-existent. Researchers commonly complain about the lack of data or incomplete data, but for those who study veterans the lack of longitudinal data is a very real impediment for academic and non-academic researchers alike. It leaves us without information linking social origins before service to the complex set of experiences while serving, or to economic outcomes after service. It means researchers struggle with concerns about causality because we have limited information about veterans pre-service. And we have surprisingly limited information about the immediate process of transition between military and civilian worlds and how new veterans adapt over time. But in this case, the lack of longitudinal data meant it was near impossible to find information about the current residence of veterans linked to their pre-enlistment geographic origins.
Without the data, I was left to try and tell a plausible story about the relative fractions of enlistments from rural areas, compared against the relative fractions of veterans in rural areas to understand if people disproportionately leave rural origins for the military and whether they (or some different veterans) come back to those communities in relatively equal shares or not. Even doing this would be challenging to try and get the timing right using the currently available data sets on veterans.
In my initial search for information, I quickly ran across a minor controversy from a few years back. White House officials in the Obama administration, and even the President himself, had taken to quoting the following statistics about enlistments from rural America: that while 17% of the population lived in rural areas, 44% of new enlistees came from rural areas. This claim was repeated multiple times by different officials. On its face, this seems implausible. There are some striking social differences in the world, but this just seemed exaggerated compared with the scale of other rural/non-rural differences. When eventually pressed about the source of the claim, it seems the statistic was taken from an article in the Washington Post, based on an analysis by the National Priorities Project (NPP).
My first thought was that it seemed a bit sloppy or lazy for high level officials to quote important statistics, especially ones that seemed surprising, based on what they read in the paper. And that the story in the paper was based on analysis provided by a non-profit organization that while officially non-partisan, isn’t exactly politically ambivalent or neutral. The NPP data have since been taken down, and I was left unable to verify the claims made in the article, which we data analysts typically want to do. So I set out to try and construct my own analysis with the available data to come to a conclusion about the enlistment rate for rural young adults.
First, a colleague provided some unpublished descriptive statistics on military enlistment among the cohort of young people who were high school sophomores in 2002 in the Educational Longitudinal Study (ELS dataset). Specifically, these data had been limited to men only for the purposes of her analysis. According to her yet-to-be published results, 26% of those who had enlisted by 2012 (who were sophomores in 2002) were from schools in rural areas, while 50% were from suburban schools, and 24% from urban schools. Rather than the 44% figure that had been quoted by officials, she found 26% were from rural origins. But thinking about the figure that 17% of the total population lived in rural areas (a figure that is correct based on American Community Survey data from the Census), it relies on place of residence, and these data rely on place of school. And it wasn’t entirely clear that the same definitions were used to define what is considered to be a rural place between the two data sources (the ELS and the ACS). And this still didn’t help me understand where the statistic that 44% of enlistees were from rural origins came from.
The original story in the Post about the NPP analysis suggested they had used DoD enlistment data based on the “home of record” zip codes of new enlistees. So I tried to track down similar data. I have other research colleagues who have used data containing geographic identifiers, and asked them if they could produce a summary indicator of enlistment rates from rural zip codes. This was a non-trivial task and not feasible in the few days I had to produce my presentation.
Eventually I found that the recent years of the Population Representation in the Military reports provided data on geographic origins of new enlistees. I thought I had finally found a source for a credible and simple statistic to open my presentation!
I pulled all of the data from 2008-2015, the years in which they reported rural/urban origins, from the POPREP reports. They provide tables like the following (original):
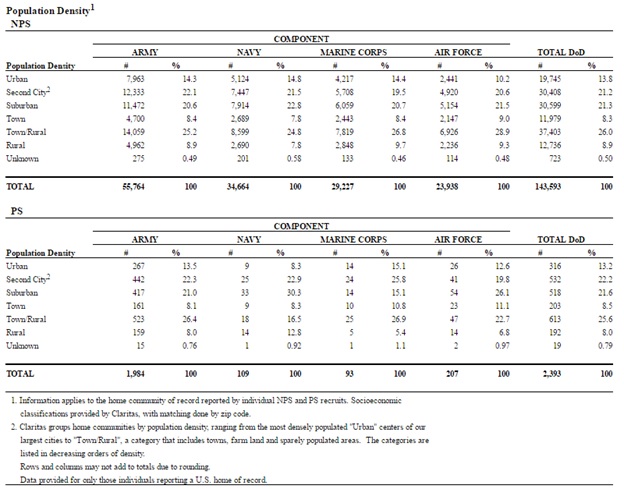
The last column of the first sub-table shows the percentage of the “non-prior service” accessions (or new recruits) by their home of record location. The footnotes show that a commercial marketing firm, Claritas, defined these locations with categories of population density based on zip codes, but offers no clear definitions for these categories. Going over to the Claritas website offers a little more information, but not enough. Here, they describe a combined category, “Town and rural” as
Town & Rural areas have low population density scores under 40. This category includes exurbs, towns, farming communities and a wide range of other rural areas. The town aspect of this class covers the thousands of small towns and villages scattered throughout the rural heartland, as well as the low density areas far beyond the outer beltways and suburban rings of America’s major metros. Households in the exurban segments have slightly higher densities and are more affluent than their rural neighbors.
Given this information, how then are the three mutually exclusive categories of “Town”, “Town/rural”, and “Rural” used in the POPREP report defined? You might think these are just the musings of a data nerd or nutty professor. But this gets to the crux of the controversy around the White House claims. When you add the numbers in the three categories I just mentioned they total 43% in 2015, and 44% in earlier years. And that 44% sounds familiar, doesn’t it? Since these DoD enlistment data use zip codes to identify home of record, my strong suspicion is that NPP used this Claritas definition of rural in its reporting, which was then covered in a story by the Washington Post, which then became “fact” and was then widely used in talking points by White House staff and President Obama. Without any details provided about how these categories were constructed, it is impossible to compare this data to data on rurality using a different metric. And the Census uses a different metric.
I did my due diligence and reached out to the authors of the CNA report (which is mandated by the Senate Armed Services Committee by the way, so it is a very important annual report) and they could not offer any details on the construction of the Claritas geography categories. They basically sent me the same information that is available on the Claritas website. I decided to call the Claritas company and spent about 20 minutes with someone who couldn’t even think of who in the company they could connect me with who could tell me how these three categories were defined. I was told that the models were very complicated with lots of variables, but couldn’t be connected with the person responsible for constructing the models or measures.
To be blunt, this is terrible all around. But it highlights just how poorly many of us, even important and powerful people, understand some of the details of data and data analysis. This tale reveals just how crucial data literacy is for all professionals and citizens. There is a lack of standard data analysis practices on full display in the POPREP report. A key part of reporting analyses is explaining in detail what measures were used and how they were constructed. Being transparent about measurement allows other researchers to replicate findings on the same terms as the original research. It allows readers to comprehend the information and to understand to what it might be compared. The lack of clear definitions of the categories used in reporting leads to misunderstanding and misuse when readers try to compare these data to other information.
It seems strange as well that the DoD would use a commercial marketing firm’s definition of something when the Census Bureau defines it quite differently. In doing so, they virtually ensured the data will be misused. It is also problematic that the NPP took down, or failed to make clear what happened with the original report. Rather than issuing a correction or clarification indicating a problem or concern about their report, they seem to have just ghosted the original information. However traces remain, because the media had picked it up. The example also highlights the problem of reporting on non-peer reviewed reports by watchdog groups and advocacy organizations who may not follow standard research practices, and who don’t have clear processes to ensure quality and accuracy in their analyses. It’s sloppy that government officials used a statistic from a media story without verifying it’s origins or it’s context. This is especially surprising when the government employs a massive and competent research workforce who are paid to do exactly this kind of work!
Not to mention that all of this led to a dramatic overstatement of the representation of rural youth among military enlistments. I used the DoD provided data using the Claritas measure of rurality, and found some nationally representative data on the US population using the same measure via the National Household Transportation Survey in 2009. I had to use this data because, as a non-standard metric for rurality, there isn’t much publicly available, nationally representative data that uses the measure. The figure below compares enlistments to the general population in 2009 on the same metric.
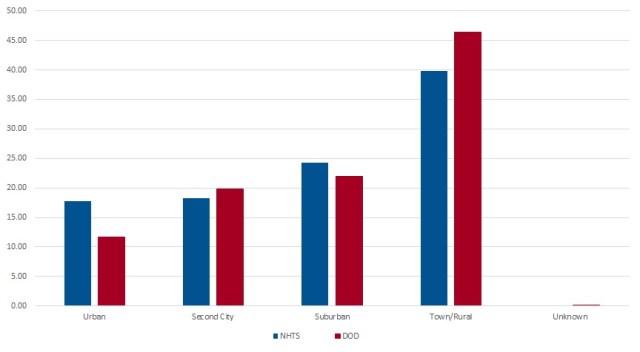
These data confirm the conclusion that rural youth are over-represented among enlistees—about 46% of enlistees came from rural or small town areas while only 40% of the general population lived in these same locations, but the difference looks quite a bit more modest than the 44% vs 17% originally reported in the Post story. But after several days of data sleuthing I finally found (I think) why–because of the comparison of two measures that seem on the face to be of the same underlying thing (rural residence), but which use two very different definitions. It’s akin to measuring my height as 71 inches, and my husbands as 173 centimeters, and concluding he’s more than twice my height!
So what’s the lesson about veterans? Rural young people are more likely to enlist than their urban peers, and there is a higher rate of rural residence among veterans. But the differences are not as dramatic as has been widely reported in the media. How rural origin enlistees transition back to civilian life, and whether they return to rural places or not (and why) is something of a black box. The bigger lesson in my search for a simple descriptive statistic is about data literacy. Researchers, students, journalists, and policy makers especially need to be very savvy about how to use data, and how to not misuse data. We all need to consider even simple descriptive statistics critically, and ask where they come from and how they were measured before using them in comparisons or to make a rhetorical point. And we should all ask these hard questions of the soundbite data points we read about in the news. One of the greatest skills even undergraduate sociology majors should have is the ability to analyze simple statistics, to think critically about metrics and definitions, and maybe to go out and get the source data, and “roll your own” figures to check against what is being reported.
