
I frequently see links to sites purporting to identify the Best ___ for Veterans. Best Cities for Veterans, Best Colleges for Veterans (although this list is different from this one, or this one, or the others that circulate on the internet.) These rankings combine multiple criteria like actual outcomes for veterans, availability of veteran-connected resources, and attitudes, satisfaction, or sentiment measures. Many veterans care about economic opportunity as they transition out of the service. Veterans tend to be more geographically mobile than other groups, and are especially mobile at the time of transition out of the military. Veterans must take many factors into consideration when separating from their service and contemplating relocation, including availability of jobs, and relative pay. Veterans may wish to know where veterans appear to be doing relatively well, compared to their civilian peers. So I tried to use available data to gain insight into where veterans do relatively better than their non-veteran peers in terms of earnings.
I examined nationally representative, publicly available data on the economy and work available over nearly 4 decades. NBER provides free access to the Current Population Survey data, in particular the Earner Study data, often referred to as the MORG data (Merged Outgoing Rotation Groups data). The CPS is the national data used to produce official unemployment estimates, and reflects high-quality data. The MORG is available from 1979-2015, and allows for a breakdown of many employment-related statistics by state and by veteran status. Using hourly-equivalent earnings computed in 2010 constant dollars and adjusted for topcoding of the highest earners in the CPS, it is evident that veterans earn higher wages than non-veterans in every year in every state. The figure below presents trends in the veteran premium (the difference between average veterans and non-veteran earnings) for each state (in blue) in the MORG data and the national average (in black). In the link below, you can view the figure interactively, identifying trends from individual states for comparison (thanks WordPress.com for not allowing embedded Tableau worksheets.)
There is substantial variation by state in the relative premium earned by veterans. But, these data are not adjusted for age or sex composition, and could reflect different population compositions across states, and importantly between veterans and non-veterans. For example, veterans are on average older than non-veterans, because of declining rates of military service across birth cohorts. Also, states have different age compositions, and the veterans in each state may be of different ages. If Vermont has a relatively older population than Virginia, and if the older veterans are not in their prime earning years, whereas more Virginia veterans are, then the high veteran premium in Virginia may simply reflect there being more prime-age earners in Virginia than Vermont.
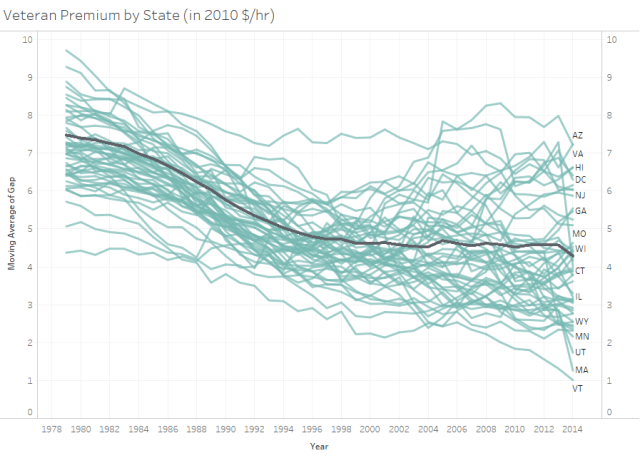
The unadjusted data suggest fairly substantial veteran advantages across the states, as well as large changes over time for some states. In the early 1980s, places like Maryland, Connecticut, and Delaware were at the top of the heap, offering the largest veteran premiums, or advantages for veterans over non-veterans. By 2015, Connecticut and Delaware fell below the national average, and Maryland hovered just above it. Today, veterans in Virginia, DC, and Arizona showed the highest premiums over civilians, earning roughly $7/hr more than non-veterans in that state. These dollars are “real” dollars, meaning they are adjusted for inflation over time.
After adjusting for age differences across states and by veteran status, the picture changes a bit. The estimates in the next figure predict average wages assuming everyone is age 35. Because average age varies by state, by time, and by veterans, I chose a reference age at mid-work life.
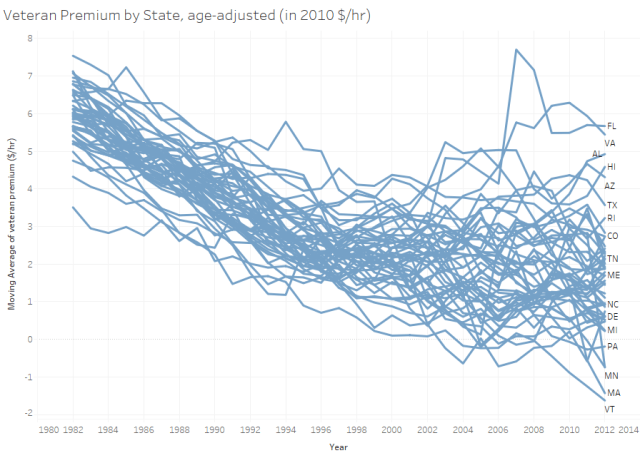
Veteran earnings advantages over non-veterans appear to have declined from 1980 to about 2001 overall. After 2001, trends differentiate. Some states saw continued declines, while other states saw increasing veteran pay premiums. By 2014, veterans earned on average about $5/hr more than non-veterans in places like Florida and Virginia, while they earned $1-2/hr LESS than non-veterans on average in Vermont, Massachusetts, and Minnesota.
These trends do not provide much insight into why states differ from each other. And veterans probably don’t want to make a move to Alabama just because of these findings. But the variation we observe offers an interesting research puzzle to solve. Is the growth of military contracting industries related to the veteran earnings premiums observed here? What are the industries and occupations where veterans are working compared to non-veterans across states? Or is it just the demographic mix of veterans and non-veterans in each state. These figures do not control for sex, race, education or other compositional differences between groups and/or states. A more thorough analysis would need to control for all of these demographic factors as well as age.
Another key consideration is how average earnings relate to unemployment and labor force participation. Veteran earnings appear relatively high, but it may also be true that veterans experience higher unemployment rates (as found in some of my other research.) That is, a group can experience difficulty getting a job, but also have high earnings among those who do end up getting jobs. There may be stratification among veterans, where some have the skills and training to be highly employable (and highly paid), while other veterans may have less in-demand skills and experience, and therefore don’t easily find jobs. When analyzing earnings, researchers usually only include those with ANY earnings in the analysis. Therefore, anyone without earnings because they are without a job isn’t included in this analysis.
There’s nothing conclusive from these figures, but I’m looking forward to further research breaking down when, where, and why veterans seems to be doing relatively better or wore than their peers in the workforce.
